

[vc_tta_tabs spacing=”” active_section=”1″ el_class=”smsfaLayoutTabs paysurveyLayoutTabs”][vc_tta_section title=”Playing the Pay Game” tab_id=”1518067480981-465e6d0b-205d”]
PERFORMANCE-BASED REMUNERATION, long the norm across the highly paid for-profit funds sector, is now also commonplace in the non-profit funds sector. And there’s no magic formula FOR HOW TO MAKE IT PAY OFF FOR MEMBERS.
As the superannuation sector continues to grow in size and complexity, funds are increasingly looking to attract and retain top-performing executives from banking and funds management.
Accordingly, more non-profit funds are now offering top executives remuneration packages that incorporate incentives. This strategy is not without controversy and funds are under pressure to prove the remuneration structures they use do, in fact, help them employ the best talent and produce the best outcomes for their members.
The 2018 Investment Magazine Super Fund Salary Survey confirms that at least 20 of the 50 largest non-profit funds offer a bonus scheme to their chief executive, while at least 22 of the 50 largest funds have a bonus scheme for the chief investment officer.
We use the qualifier “at least” because the survey includes a number of government funds that do not disclose whether bonuses are applicable.
The Investment Magazine Super Fund Salary Survey is now in its fourth year. It reflects remuneration information for the financial year ended June 30, 2017. The survey includes the 44 largest nonprofit licensed super funds, based on Australian Prudential Regulation Authority data for the period, and the country’s six largest government pension funds.
The survey does not include bank-owned or other for-profit super funds because the regulator does not require them to disclose comparable data.
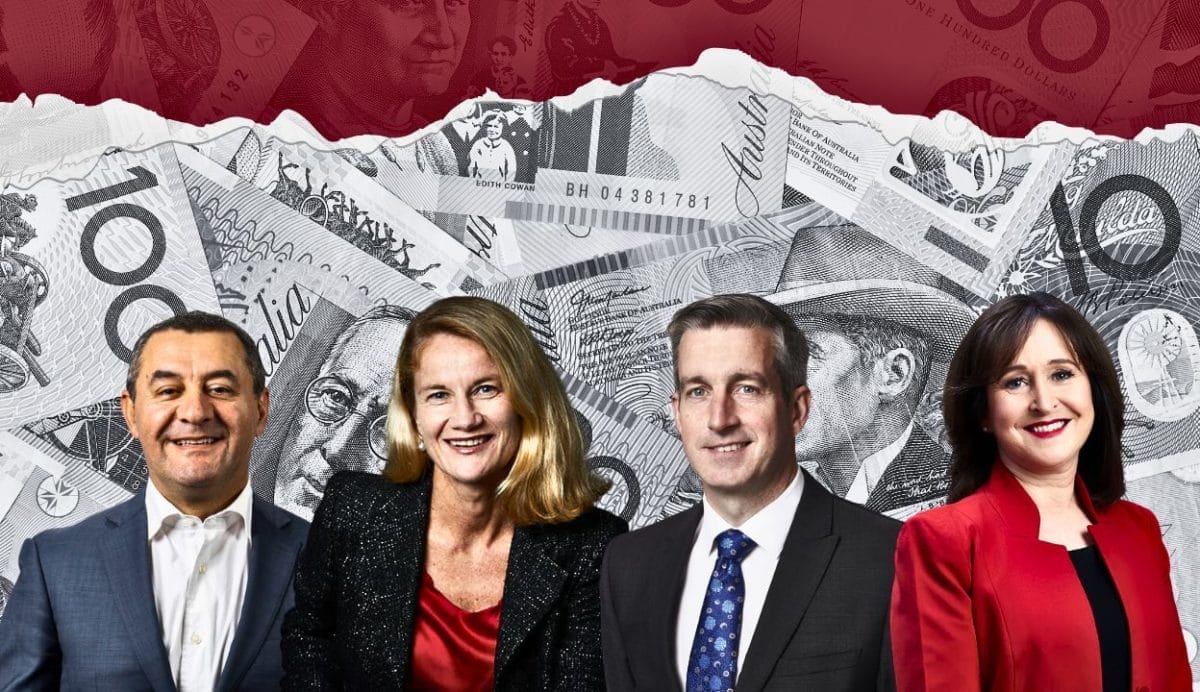
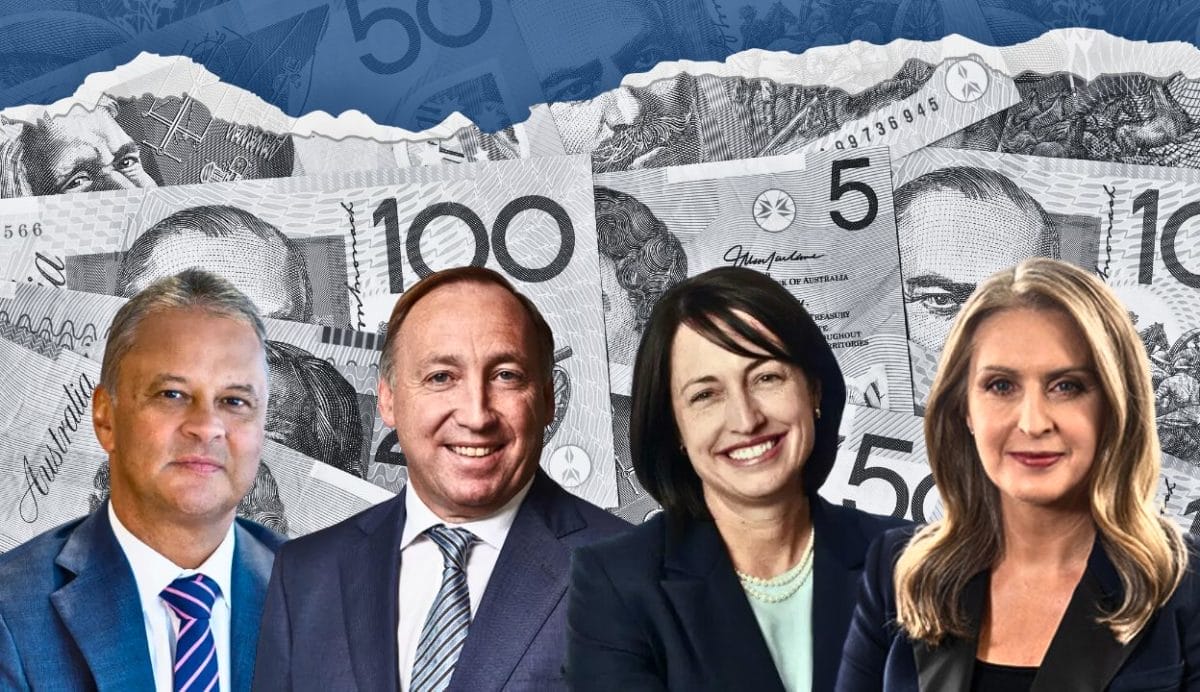
The Future Fund’s David Neal topped the list of highest-paid CEOs in the survey, earning $1.26 million, while the highestpaid CIO was UniSuper’s John Pearce, on $1.43 million. The most handsomely paid chair in the sector was again TWUSUPER’s David Galbally, on $277,200.
Top 5 earners
The highest-paid CHIEF INVESTMENT OFFICERS
Click here to view the full table of the CIO pay at the 50 biggest super funds
The highest paid CHIEF EXECUTIVES
Click here to view the full table of the CEO pay at the 50 biggest super funds
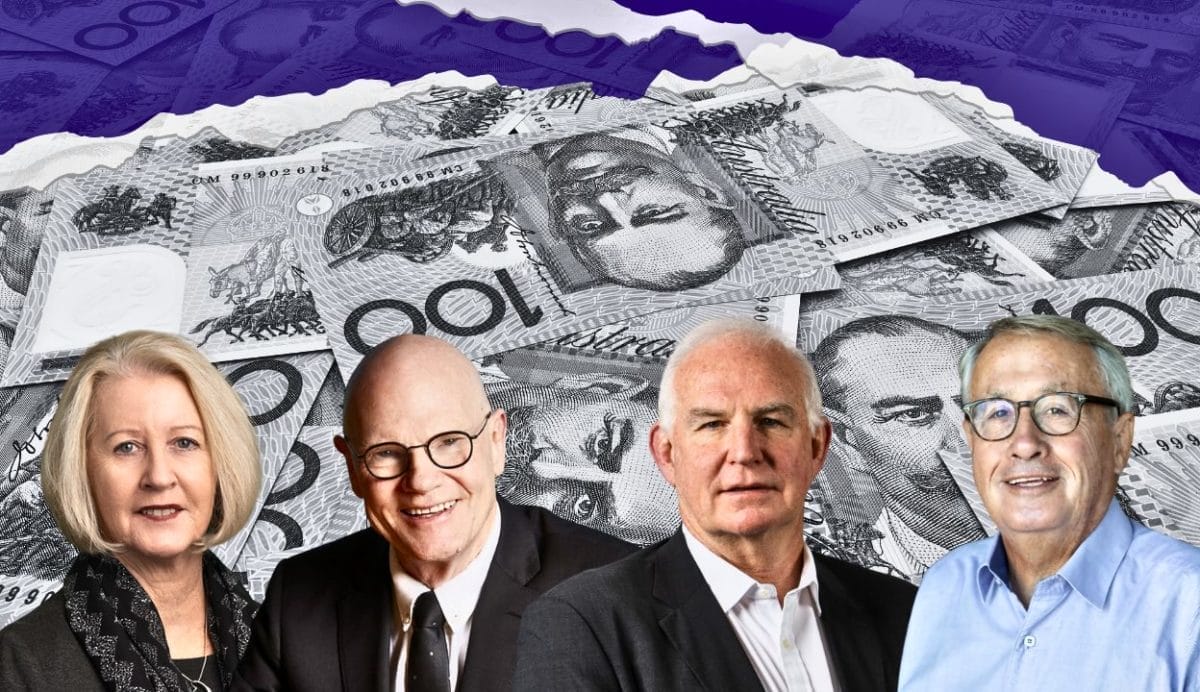
The highest-paid CHAIRS
Click here to view the full table of the chair pay at the 50 biggest super funds
CIO BONUSES THE NORM
As the individuals responsible for investment performance, CIOs are routinely the best-paid employees within super funds.
The 2018 Super Fund Salary Survey showed UniSuper CIO Pearce was not only the highest-paid employee of his fund, but also the highest earner in the survey, making $1,433,738. His remuneration reflects the myriad complexities of running a combination of defined benefit and defined contribution funds, and managing more than half of the $61.6 billion fund’s assets internally.
In 2016-17, UniSuper changed the variable component of its CIO’s total available remuneration (TAR), increasing his maximum potential bonus from 100 per cent to 120 per cent of his base pay. Pearce’s base salary of $589,480 was augmented by a $724,517 short-term incentive payment, superannuation contributions of just over $100,000 and a long-service leave payment of $19,529.
AustralianSuper CIO Mark Delaney’s take-home pay was just shy of Pearce’s, at $1,430,780, after his base of $680,890 was supplemented with a performance-based variable component of $714,890, and superannuation contributions of $35,000. AustralianSuper is building its internal investment team and already manages roughly $28 billion of its total assets internally.
It is notable that the two highest-paid CIOs run big and growing internal teams that save members many millions of dollars in external fee payments each year.
MORE AT RISK
UniSuper executive manager of people and member services, Lee Scales, says key executives should have some remuneration at risk, linked to fund performance, to align them with members’ interests; however, she says some funds “continue to have no ‘at-risk’ component, but appear to be paying their executives at similar levels to those with an ‘at-risk’ component”. “This means there’s no scope to move the dial on salary commitment for performance variation,” Scales says. “We believe having a portion of our executives’ remuneration that is variable and aligned to fund performance is more appropriate than having their entire compensation package fixed, and therefore not responsive to performance that benefits members.”
The third highest-paid CIO came from the $38 billion default fund for federal public servants. Commonwealth Superannuation Corporation (CSC) rewarded CIO Alison Tarditi with total remuneration of $1,214,478. Tarditi’s base salary of $624,741 was supplemented by $556,389 of short-term cash profit-sharing and other bonuses, plus benefits including superannuation.
Future Fund CIO Raphael Arndt’s base salary of $568,421 was pumped up with a $556,334 payment under the Future Fund’s performance-related payment (PRP) plan, which incorporates assessments of both an individual’s personal performance and investment performance.
Up to 70 per cent of Arndt’s potential performance pay is tied to the fund meeting its aim of a return of at least Consumer Price Index (CPI) plus 4.5 per cent over rolling three-year periods.
At QSuper, CIO Brad Holzberger’s short-term cash incentive payment represented about 72 per cent of total variable remuneration available to him, which the fund’s remuneration report states is assessed against “long-term absolute investment return targets and thresholds which are set by the board within approved risk tolerances”.
Holzberger’s $994,439 total remuneration ranked him fifth among fund CIOs. His total remuneration comprised base pay of $504,141, a short-term cash incentive of $442,048, and other benefits, including superannuation and long-service leave, totalling $48,250.
CARROTS FOR CEOs
An increasing number of fund chief executives are also now eligible for bonuses as part of their remuneration plan.
The same PRP that lifted Future Fund CIO Arndt’s base rate also substantially boosted fund chief Neal’s total remuneration, making him the highest-paid CEO in the survey. Neal’s base of $613,608 was supplemented with $610,605 in 2016-17, of which $413,111 was attributable to meeting investment performance targets – measured over rolling three-year periods – and $197,494 was for meeting personal performance targets.
The Future Fund provides that Neal may earn up to 120 per cent of his base pay through the various components of the PRP, and in 2016-17, he earned about 80 per cent of the total amount available.
Local Government Super chief Peter Lambert left the fund in April 2017 and made an unexpected entry into the top five in this year’s survey, after receiving a termination payment of $644,281 on top of his base pay of $436,115. The year before, Lambert’s total remuneration was $552,648, placing him 19th overall, at a level more commensurate with running a $10.5 billion fund.
Victorian Funds Management Corporation chief executive Lisa Gray received total remuneration of between $950,000 and $959,999 for the year, with a base salary between $540,000 and $549,999. While VFMC’s annual report doesn’t detail additional payments, it states that the board determines an incentive pool each year, based on annual investment returns, which is distributed among executives. QSuper’s Michael Pennisi received a short-term cash incentive payment of $332,598 (of which $66,625 is deferred for two years) and a long-term incentive payment of $28,410, plus other benefits, including superannuation and long-service leave. All this was on top of his base pay of $519,565, for a total package of $985,273.

“Given the complex nature of the QSuper group – including a wholly owned group life insurance business, a personal financial advice firm and mortgage broking services, and our in-house investment team and administration – the board seeks to ensure that the team is remunerated in line with the market,” QSuper remuneration committee chair Beth Mohle says.
Mohle explains that the fund’s executives are “subject to clear performance criteria relating to customer, member, people and risk perspectives, and remuneration includes a mix of fixed and variable payments explicitly linked to this performance”.
Over at Sunsuper, bonus payments and superannuation, including voluntary contributions, took chief executive Scott Hartley’s total remuneration to $938,992, including his base salary of $560,603 and a performance bonus, including superannuation, totalling $301,918. Three-quarters of that bonus will be paid in 2017-18, and one-quarter not until 2018-19. A component of Hartley’s bonus reflected in the current survey was earned for his performance in 2015-16.
Over at the country’s largest industry fund, AustralianSuper, Ian Silk was the sixth-highest paid chief executive in the survey, earning a total of $887,142.
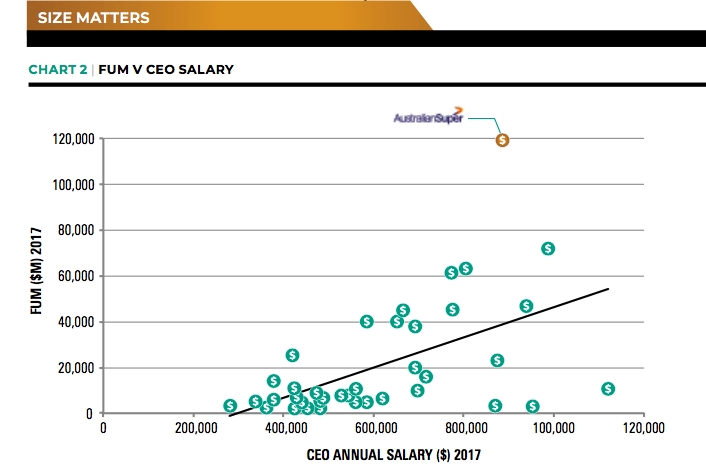
Chart 2 shows analysis by Investment Magazine that plots CEO pay relative to fund size, as measured by funds under management. Those dots above the trend line indicate funds where pay was below average relative to fund size. Silk stands out as the best ‘value’ chief on this measure.
And unlike his deputy, Delaney, and other senior members of the AustralianSuper investment team, Silk was not incentivised with a bonus scheme.
AustralianSuper general manager of people and culture Margie Hill says performance-related pay structures must have clear targets, be available to the right staff, and not be too complicated.
“What’s good for Ian is good for many others [in the organisation] as well,” Hill says. “We pay very competitive fixed remuneration, of course, or else we wouldn’t attract and retain people. But we have a strong philosophy of not paying performance-based incentives.”
But perhaps the best test of a performance-pay scheme is not when bonuses are paid, but rather, when they are not paid. Hill says that in 2011-12, AustralianSuper paid out zero under its investment performance payment plan, after the fund failed to meet the target of exceeding the rate of inflation.
“Unlike other organisations, where there might be a bit of healthy fudging, it’s quite black-and-white here,” Hill says. “That’s the point about very measurable targets; it’s not just becoming a backdoor way to getting additional fixed pay, it’s very much about performance-driven pay.”THE RIGHT INCENTIVES
Across the industry, funds are grappling with how to design incentive structures that get the most out of executives and deliver the best outcomes to members.
In 2017, Mine Wealth + Wellbeing – one of the earliest industry funds to adopt performance pay for a significant number of positions – decided to partially unwind its scheme and ditch bonuses for all but nine senior executives, including CEO Harry Mitchell, CIO David Bell and chief strategy officer Vasyl Nair.
Nair says a review of the fund’s strategic goals led to an evaluation of the remuneration structure and the decision to consolidate fixed remuneration with variable remuneration for most of those who participated in the variable pay scheme. Consolidating the variable component at 100 per cent meant no employee was worse off as a result; however, none of the team of nine who still receive variable pay emerged better off either.
The fund also enhanced its performance management framework, to mitigate the removal of variable remuneration as a blunt instrument to drive performance. While it’s early days, Nair says “a robust performance framework, in our view, more than counteracts the effect of not having a variable remuneration lever”.
Basically, he argues the mid-sized fund needed a remuneration plan that was less complicated and easier to administer.
Meanwhile, Cbus Super is heading in the opposite direction. The fund is expanding the scale and complexity of its incentives program to include more members of its growing investments team.
Cbus CIO Kristian Fok says the $40 billion construction industry fund has recently introduced a variable pay structure for a limited number of investment staff to help it attract and retain the best talent. While variable pay is “designed to drive successful outcomes for members”, he says it is still too soon to tell what impact it will have in practice.
The incentive scheme won’t be based only on investment returns.
“Key factors in the design of our program include a heavy focus on positive behaviours consistent with Cbus’ values and member-focused culture, fostering a shared responsibility for total portfolio outcomes, and an alignment with longerterm investing principles,” Fok explains. “When developing our variable pay program, we established appropriate measurement tools and, where possible, we have tried to keep the assessment criteria simple. Any payments earned from the program are spread over a three-year period.”

LOOKING AHEAD
It seems clear that incentive payments will only become a more common feature of super fund executive pay.
Executive recruitment firm Alexander Hughes’ managing partner, Asia-Pacific, Michael Swinsburg, says fund executives will, and should, continue to be rewarded for producing good results for members, but funds are still grappling with how to structure incentives to reward appropriate behaviour and performance without compromising a member-first ethos.
“I don’t see bonuses in some shape or form going away,” Swinsburg says. “I expect these to become more targeted, over time, to longer-term, three-years-plustype programs, particularly for senior executives.”
As they continue to build out expertise, “profit-for-members funds will probably make mistakes along the way, and could import poor culture”, he says. “But as long as they are looking to build more sustainable, high-functioning teams [rather than] squeeze in glamour individuals, which would be anathema to their culture anyway, then they should be on the right track.”
JANA executive director John Coombe says it’s still difficult to prove conclusively that performance-based remuneration leads invariably to better member outcomes.
“I don’t think you can,” Coombe says. “You would have to know all of the details [of a remuneration scheme] and you would have to monitor it over an extended period of time.”
He says a portion of executive pay should be deferred over at least three to five years or longer, to reflect a typical market cycle and tie executive remuneration more closely to longer-term member outcomes. And he adds that while funds do discuss performance-based remuneration among themselves informally, there is still inconsistency and disclosure needs to be addressed if funds are to make their case conclusively.
Reporting with thanks to lead researcher Reshma Gupta.
CORRECTION | The original version of this story, in both print and digital, included a graphic ‘Chart 1’, which plotted CIO pay relative to their fund’s 3 year net returns. Due to a data entry error this chart, and therefore the accompanying analysis, was incorrect. Investment Magazine has chosen to remove this section of the story in its entirety and apologises for the error.
[/vc_tta_section][vc_tta_section title=”CIO Pay” tab_id=”1518075646957-d6eb18ec-9114″]Chief investment officer pay at the 50 biggest super funds
[vc_btn title=”Download Table” color=”primary” align=”center” i_icon_fontawesome=”fa fa-file-pdf-o” add_icon=”true” el_class=”pay-survey-button” link=”url:https%3A%2F%2Fd1mwzmktacfw26.cloudfront.net%2Fwp-content%2Fuploads%2F2018%2F02%2F16144834%2FIM-0218_CIO.pdf|||”]
Notes:
1. Retired on July 15, 2016; total remuneration includes $644,259 termination payment
2. Average remuneration of five highest-paid TCorp executives disclosed in annual report
3. Appointed July 15, 2016
4. Retired March 17, 2017
5. Appointed November 1, 2016
6. Appointed March 20, 2017
Source: Super fund annual reports, remuneration reports and websites. All data is for the financial year ended June 2017.
[/vc_tta_section][vc_tta_section title=”CEO Pay” tab_id=”1518490340881-c71dec42-6657″]Chief executive pay at the 50 biggest super funds
[vc_btn title=”Download Table” color=”primary” align=”center” i_icon_fontawesome=”fa fa-file-pdf-o” add_icon=”true” el_class=”pay-survey-button” link=”url:https%3A%2F%2Fd1mwzmktacfw26.cloudfront.net%2Fwp-content%2Fuploads%2F2018%2F02%2F16144856%2FIM-0218_CEO1.pdf|||”]
Notes:
1. Retired April 27, 2017; includes termination payment of $664,281
2. Highest-paid “responsible person” disclosed in annual report
3. Average remuneration of five highest-paid TCorp executives disclosed in annual report
4. Highest-paid executive disclosed in annual report
Source: Super fund annual reports, remuneration reports and websites. All data is for the financial year ended June 2017.
[/vc_tta_section][vc_tta_section title=”CHAIR Pay” tab_id=”1518490353862-80fff8ae-7f81″]Chair pay at the 50 biggest super funds
The chairs in the survey earn nothing like the salaries of the top executives they govern.
TWUSUPER chair David Galbally again topped the list of highest-paid chairs, earning $277,200 for the year, despite the fund being one of the least complex and smallest in the survey, with less than $5 billion in funds under management. Galbally’s remuneration was unchanged from the previous year, and again paid to Madgwicks Lawyers, a legal rm where he is a partner.
Despite TWUSUPER being just 3.6 per cent the size of the $134 billion Future Fund, Galbally’s fee was more than 25 per cent higher than the $206,330 the sovereign wealth fund paid its chair, Peter Costello (in third place). Similarly, even though TWUSUPER is about 4 per cent the size of AustralianSuper, Galbally made more than 44 per cent above the $192,167 earned by its chair, Heather Ridout.
A written statement provided by TWUSUPER chief executive Frank Sandy said Galbally’s fee was “commensurate with his role as an independent chair” and acknowledged the “considerable time, effort and expertise” associated with the role.
David Leggo was the second highest-paid chair, earning $226,097 at $20 billion corporate fund TelstraSuper. That’s more than the $203,000 $45 billion fund REST Industry Super paid to its chair, Ken Marshman (the fth highest-paid chair in the survey).
Until 2013, the directors of REST were paid nothing except out-of-pocket expenses, but since 2014, director remuneration has been calculated according to the complexity and depth of each director’s individual involvement with the board and its committees. REST directors’ remuneration is due to be reviewed again this year.
[vc_btn title=”Download Table” color=”primary” align=”center” i_icon_fontawesome=”fa fa-file-pdf-o” add_icon=”true” el_class=”pay-survey-button” link=”url:https%3A%2F%2Fd1mwzmktacfw26.cloudfront.net%2Fwp-content%2Fuploads%2F2018%2F02%2F16103802%2FIM-0218_Chair1.pdf|||”]
Note:
1. Second-highest-paid “responsible person” disclosed in annual report
2. In all pay tables, remuneration beyond base pay may include bonuses, non-cash benefits, deferred cash benefits, super, and miscellaneous payments such as training fees and reimbursement
of travel expenses or health and wellbeing expenses.
Source: Super fund annual reports, remuneration reports and websites. All data is for the financial year ended June 2017.
[/vc_tta_section][vc_tta_section title=”Editor’s note” tab_id=”1518745249794-4c3ed885-14ac”]
As is tradition, our first issue for the new year includes the annual Investment Magazine Super Fund Salary Survey.
We first began collating and comparing pay data for the chief executives, chief investment officers and chairs of the country’s largest non-profit funds four years ago.
Some of the executives and trustees whose salaries are highlighted in the survey are understandably made a bit uncomfortable by it. A few have noted that gawking at other people’s pay packets is all a bit gauche.
That said, the readership numbers on Google Analytics don’t lie. So, don’t deny you love it. Even if you do complain.
One challenge with the survey is that inconsistent rules in how the regulator requires MySuper and Choice fund providers to disclose their remuneration data lead to the survey excluding retail funds, which typically pay more generously.
But the thorniest issue with the Super Fund Salary Survey is its inability to place big pay and bonus packages in the context of the relative value they represent for super fund members.
For the financial year ended June 30, 2017, UniSuper CIO John Pearce was the highest-paid executive in the non-profit funds sector, taking home more than $1.4 million, over half of which was earned via short term incentive payments.
In quantitative terms, he was the biggest earner in the industry.
Considering that through the murkier lens of qualitative analysis, all indicators point to Pearce’s salary representing bloody good value to UniSuper members. The CIO leads one of the biggest, most complex, investment teams in the country; it’s well-governed and consistently high-performing. And more than half of his pay was at risk.
So, who cares how much he (or any other fund exec) earns so long as it results in better net returns to members over the long term?
In defence of the Super Fund Salary Survey, while a simple list comparing individuals’ remuneration fails to capture the nuances of relative value, a clear and comparable view of these facts is a necessary starting point for an informed debate about whether the sum and structure of how super funds pay their key people is appropriate.
The strongest theme evident in the latest data is that performance linked bonuses, long standard in the retail funds, are quickly becoming the norm in the non-profit sector.
Our recently departed editor-at-large Simon Hoyle spoke to remuneration experts to glean their insights into why funds are going down this path to attract and retain top talent, and how they are ensuring incentives are aligned with the cultural values they wish to promote.
Getting this right will be critical to the competitiveness and efficiency of Australia’s super system.
For evidence of what happens when an industry is hampered in its ability to pay market rates for talent, let us look no further than Australian Parliament.
Chief investment officer pay at the 50 biggest super funds
[/vc_tta_section][/vc_tta_tabs]
Full tables of who’s paid what:
Chief investment officer pay at the 50 biggest super funds


Leave a Comment
You must be logged in to post a comment.