

Roll with the ratings
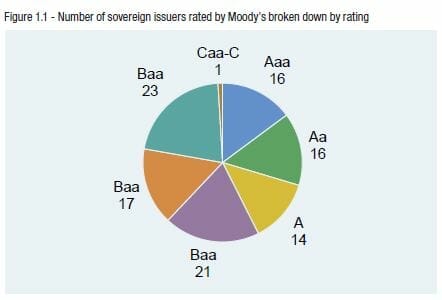
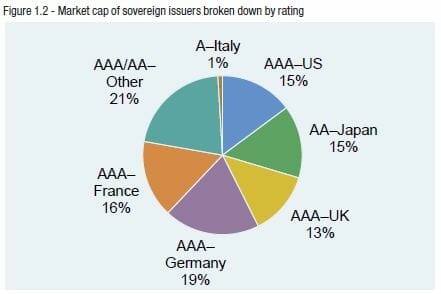
Sovereigns number about 200, and less than two-thirds of them are rated by either Moody’s or S&P. Of these, around 30 are rated AA- or better (Figure 1.1). Only 22 of these are present in the Barclays Global Treasury Index (which can be viewed as the investable universe of sovereign debt); they comprise 90 per cent of its $21 trillion market cap. Five high-rated countries (France, Germany Japan, the UK and US) account for 77 per cent of the index’s total outstanding value (Figure 1.2).
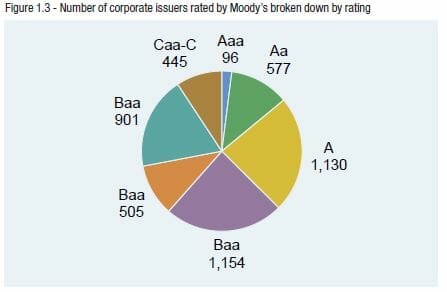
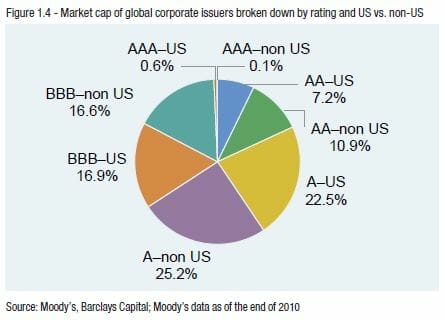
In contrast, the number of global corporate issuers rated by Moody’s and S&P was about 4800 and 5500, respectively, as of late 2010. Of these, about 1100 each were rated A or BBB (Figure 1.3). Total investment-grade capitalisation stood at about $6 trillion, of which 81 per cent was rated A or BBB as of the end of 2011. US corporate issues make up just under half the total, with a similar proportion rated A or BBB (Figure 1.4).
Seen this way, the contrast between sovereign and corporate credit risk is one between a few high quality issuers and numerous lower quality issuers. To a first approximation, the difference in average quality is accounted for by the difference in credit spreads. If each entity’s chance of defaulting is independent of every other’s, then there is evidently greater opportunity for diversification of default risk with corporate than there is with sovereigns.
Of course, corporate credits are not independent in this way, as defaults systematically rise in a recession. However, this correlation appears to be small based on available experience. For example, while one-year default rates of corporate rated Baa by Moody’s have averaged 0.2 per cent since 1983, the largest default rate recorded was about 1.1 per cent in 2002.
There is a second way in which the relative numbers of issuers makes sovereign credit risk less reliable than corporate. The default rates that we have observed are most sensibly viewed as estimates (the best we can get) of the underlying probability of default. As with every estimate, there is measurement error, and the greater the measurement error, the less confidence one has in the estimate. As one might expect, a key determinant of the measurement error is the number of independent observations used to construct the estimate. The consequences are best illustrated by the concrete example in Figure 1.5.


Leave a Comment
You must be logged in to post a comment.