

Marking a decade since their introduction, the average investment performance of MySuper growth and lifecycle products have been given very different scorecards.
Research from Chant West has found that while the typical MySuper growth option has overwhelmingly delivered above its performance goal, the lifecycle results can only be described as “mixed”.
When the country’s pension pool had less than half of its current assets in 2014, MySuper was introduced as a part of the Gillard government’s ‘Stronger Super’ package and became the only place where funds are able to receive default superannuation guarantee (SG) contribution.
The process wasn’t all smooth sailing at the time: some funds like Sunsuper (now a part of Australian Retirement Trust) weren’t able to bring out their MySuper offering until late in the year.
But ten years later, Chant West said the total MySuper assets have reached close to $1 trillion in 2024, representing 28 per cent of the entire system.
“The majority of default super is still invested in single-option growth products offered in the main by profit-for-member funds… with a growth/defensive asset split of roughly 70/30,” the report said.
The typical long-term return objective for growth funds is to beat inflation by 3.5 per cent per annum. Over this period, inflation has averaged 2.6 per cent but the median growth fund returned 7.2 per cent annually – one per cent above the 6.1 target, Chant West said.
This is on top of funds meeting their risk target as well. Over the past ten years, there was only one year (2022) where the median MySuper growth posted a negative return, whereas a rule of thumb is to have no more than two, the report said.
“In terms of meeting expectations, the members of these MySuper growth products should be more than satisfied with their experience, especially considering the period includes the Covid-19 disruption from early 2020.”
However, the lifecycle product was a different story. Flaws in early lifecycle models – most notably the “premature de-risking” in asset allocations which did end up being corrected over time – have unfortunately made a dent in returns for some age groups.
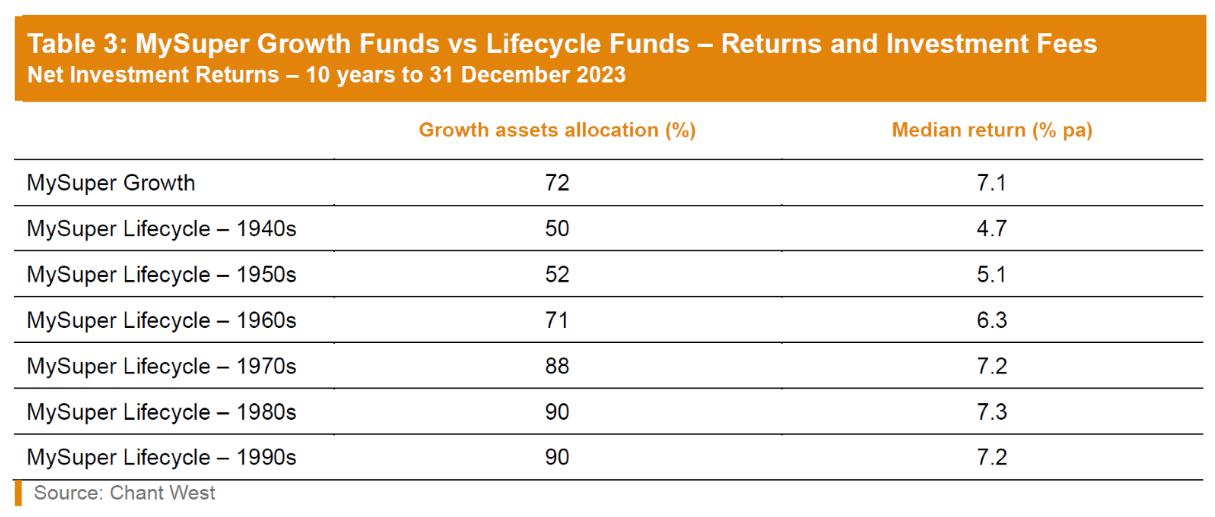
Benchmarked against MySuper growth’s median annual return of 7.1 per cent, the 1940s cohort only had a median 4.7 per cent return, followed by 1950s with 5.1 per cent and 1960s with 6.3 per cent. But age cohorts from 1970s onwards have outpaced the growth benchmark.
Admittedly, younger members enjoyed better returns because their lifecycle product took on higher share market risks. Older cohorts missed out on some of growth assets’ due to early exit but did have greater downside protection in extradentary event like the Covid-19 pandemic.
“From a performance perspective, the verdict on lifecycle MySuper products would have to be described as mixed,” the report said.
“In hindsight, older lifecycle members would have been better off had they not had their risk exposures managed for them. Better returns would have had much greater impact at those older ages, of course, because of the higher dollar values of those mature accounts.”
The report also found there was no evidence of a correlation between low fees and high returns.
If the funds surveyed were divided into two groups at the mid-point of investment fees, the results show that the median annual return over the full 10 years of MySuper is slightly higher (7.16 per cent vs 7.05 per cent) for the higher fee group.
This came after some industry push against the fee-based competition that is forming in the super sector.
The report said there was an “implicit assumption” made by policymakers and supported by “much of the media” that lower fees resulted in higher returns. “That is simply not true,” it said.


Leave a Comment
You must be logged in to post a comment.