

Investment talent became substantially more expensive for the top ten funds in the financial year ending June 2021, while salaries for the top jobs saw more modest increases, the latest Investment Magazine salary survey shows.In a period described by some analysts as “the hardest time ever to be an investor” it’s probably not surprising that aggregate pay for the top ten highest paid superannuation industry CIOs increased by around 10 per cent in the financial year ending June 2021.
By comparison, aggregate pay for the top ten highest paid super CEOs grew by only about four per cent.
But putting this in perspective, the annual average wage growth throughout the period registered between 1.4 per cent and 1.8 per cent, depending on the reporting quarter, according to the Australian Bureau of Statistics (ABS).
However, industry experts are reporting there are still specific roles out there that are having to pay as much as 20 per cent as a salary hike to attract talent post-pandemic.
Top earners
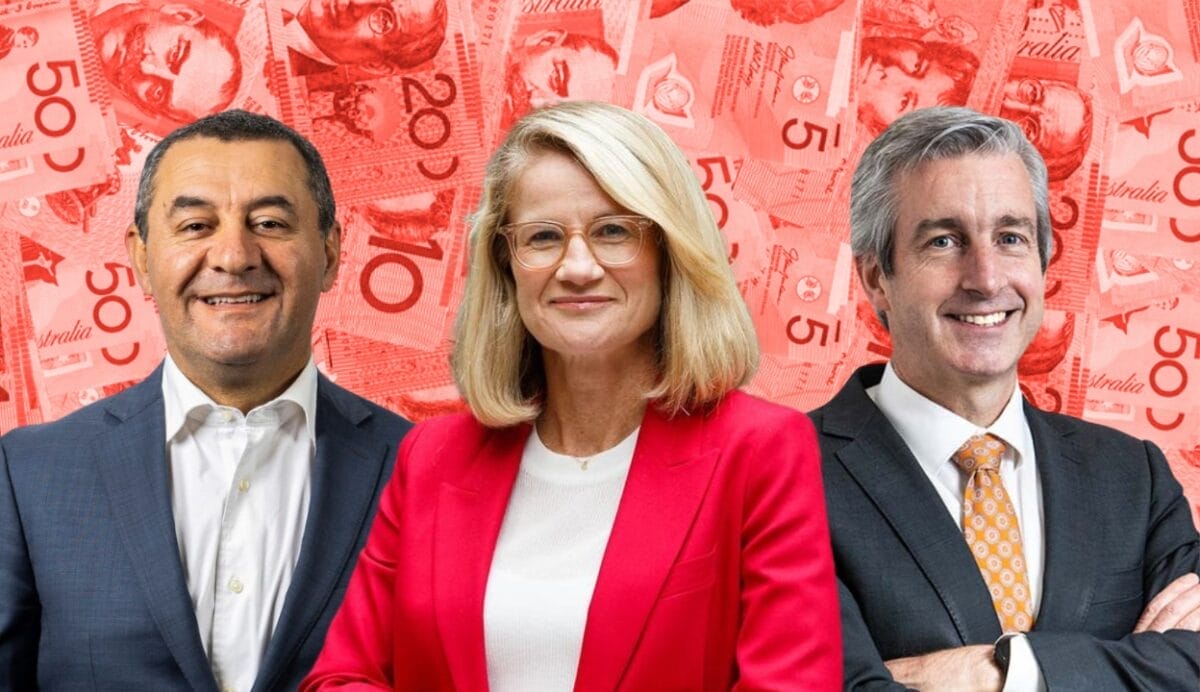
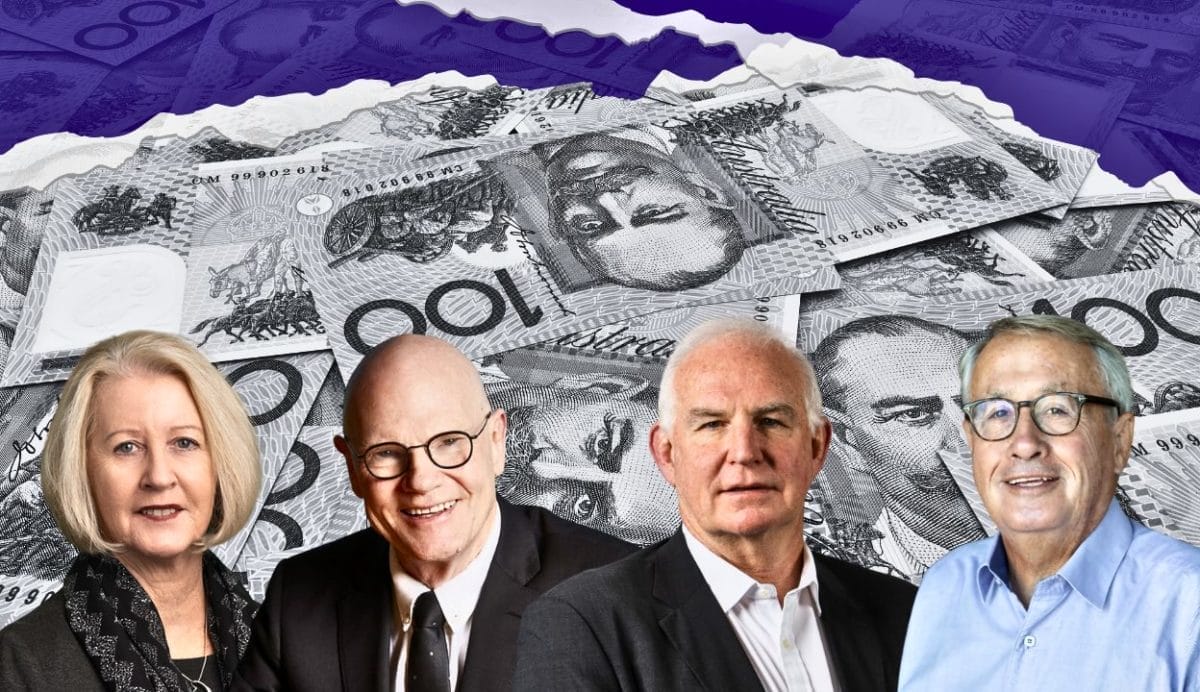
AustralianSuper CIO Mark Delaney was the highest paid individual in the industry for the second year in a row, with a total REM of $1.733 million (including a short-term incentive component of $931,000), yet his remuneration was fairly static compared with the previous survey period’s $1.705 million (including $950,000 in short-term incentives).
UniSuper’s CIO John Pearce was second on the salary table, also for the second year in a row, with $1.585 million. His short-term incentive component was $837,000.
In third place, and the first non-CIO on the list, was the Future Fund’s CEO Raphael Arndt at $1.576 million (short-term incentive component $831,000) beating out Aware Super’s CIO Damien Graham who for this survey was fourth on the overall list, being paid $1.341 million (with a short-term incentive component of $297,000).
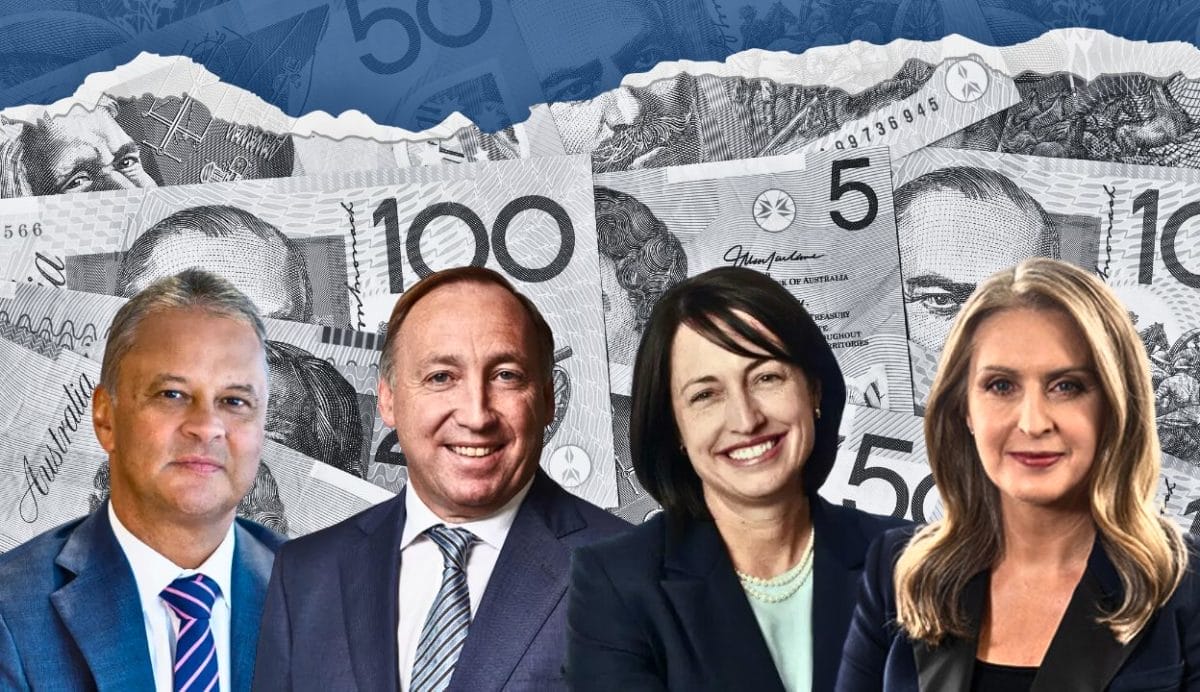
Arndt took over the mantle of the highest paid CEO from Aware’s Deanne Stewart who dropped to seventh on the overall list and placed third on the CEO list below Arndt and Hostplus’ David Elia. Elia’s total reported REM came in at $1.201 million. (NOTE: Raphael Arndt, shifted from the Future Fund’s CIO to the CEO role after the previous survey period.)
In summary, the top-paid four executives in the industry – Delaney, Pearce, Arndt and Graham – did not shift positions.
Where it started to get interesting was the number five spot on the overall list which for this survey was occupied by the Future Fund’s current CIO, Sue Brake (also the top woman on the list and a new entry into the top ten, with a total REM of $1.247 million). Last survey’s fifth-place holder, Commonwealth Super’s CIO Alison Tarditi, is now in ninth position with a REM of $1.110 million.
Another new entry into the top ten was now Australian Retirement Trust CIO Ian Patrick, who at the survey time was CIO of Sunsuper and climbed more than 30 spots to get there.[vc_tta_tabs spacing=”” active_section=”1″ el_class=”smsfaLayoutTabs paysurveyLayoutTabs blueTabs”][vc_tta_section title=”CEO” tab_id=”top-ten-ceo”][vc_custom_heading text=”Chief executive officer compensation” use_theme_fonts=”yes”]
# Denotes Derived REM (base + STI + LTI + Super + Other reported benefits) – all other REM as reported in Annual Report[vc_btn title=”View as image” color=”black” link=”url:https%3A%2F%2Fwww.investmentmagazine.com.au%2Fwp-content%2Fuploads%2F2022%2F03%2FIM-2022-Salary-Survey-Final-Prod-CEO.png|target:_blank”][/vc_tta_section][vc_tta_section title=”CIO” tab_id=”top-ten-cio”][vc_custom_heading text=”Chief investment officer compensation” use_theme_fonts=”yes”]
# Denotes Derived REM (base + STI + LTI + Super + Other reported benefits) – all other REM as reported in Annual Report[vc_btn title=”View as image” color=”black” link=”url:https%3A%2F%2Fwww.investmentmagazine.com.au%2Fwp-content%2Fuploads%2F2022%2F03%2FIM-2022-Salary-Survey-Final-Prod-CIO.png|target:_blank”][/vc_tta_section][vc_tta_section title=”Chair” tab_id=”top-ten-chairs”][vc_custom_heading text=”Chair compensation” use_theme_fonts=”yes”]
# Denotes Derived REM (base + STI + LTI + Super + Other reported benefits) – all other REM as reported in Annual Report[vc_btn title=”View as image” color=”black” link=”url:https%3A%2F%2Fwww.investmentmagazine.com.au%2Fwp-content%2Fuploads%2F2022%2F03%2FIM-2022-Salary-Survey-Final-Prod-Chair.png|target:_blank”][/vc_tta_section][/vc_tta_tabs]
Complicated investment environment
Now in its eighth year, the survey includes remuneration for non-profit licensed super funds as well as the country’s largest government funds and the Future Fund, but does not include bank-owned or other for-profit super funds. The survey is based on publicly available data for the financial year to the end of June 2021.*
To apply the simple logic that complex times equalled bigger pay packets for those charged with navigating the investment environment would belie to a certain extent the complexity of the labour market at the top end of the super industry.
The survey period before the present one actually saw the aggregate pay for the top ten CIOs jump a whopping 16 percent, six per cent more than this survey’s rise.
The pandemic played its not inconsiderable part in complicating the investment landscape, particularly in the equities market. By November 2021, the world’s most watched equity gauges, the S&P 500 and the Dow, had returned to January levels (and began setting new records) after a spectacular crash in March. Investment bosses were also faced with an environment where inflation began to raise its head as a serious issue for the first time in years and central banks started talking about applying the brakes to monetary policy.
Principal in Mercer Australia’s workforce consulting business, Indradeep Mazumdar, maintained the increases in CIO pay both for the last survey and this one reflected myriad factors including the nature of the investment environment, the increasing influence of super funds in that space as assets under management soared, the fact that talent was now being sourced from non-traditional areas and the shortage of talent generally at that executive level.
The difference between CEOs and CIOs
Pressure on CEO pay, he noted, has become more sustained because of a greater degree of scrutiny and the uniqueness of the CEO role in a super fund when compared to the CEO role of similar-sized organisations, given the APRA and BEAR implications in financial services. Also, he said, more often than not, CEOs tend to come from within the industry and other similar-sized super funds.
“For most remuneration exercises you’re trying to balance out a supply, demand ratio as well as looking at the complexity and accountabilities of the role,” he said.
“The market forces within which the CIO is operating and the forces within which the CEO is operating are quite different and that difference has been becoming more evident over the past five to 10 years. The CEO has more pressure on their salary because of the regulatory and macroeconomic changes while for the CIO, super funds would now need to procure talent from a broader market (financial services) and pay top dollar to retain them particularly in an environment where the pressure is on the funds to outperform the competition.
“So if you’re looking at a CEO of a member-focussed super fund, it’s a sector which has started to see a lot of push-back [and] the CEOs are being monitored very closely,” Mazumdar explained. “There is a lot of stakeholder engagement that has suddenly happened in the past four to five years, there is more pressure from a compliance stand point… more often than not that role has come under a lot more scrutiny than many other roles.”
Shifting market for talent
Mazumdar said from the CIO point of view, however, increasingly the market for talent was shifting and will be continuing to do so progressively into the non-super sector, particularly to the more adjacent financial services sector. More and more funds will be competing with banks, asset managers, investment banking and private equity for these roles as the investment strategies of the funds evolve over time.
He maintained if you looked at the super funds and where they used to invest, say five or six years ago, versus where they are investing in now, you’d see a pattern of investment increasing on the ASX.
According to Mazumdar close to 10-15 per cent of shareholders in ASX 300 companies were super funds and it is largely speculated that almost 50-60 per cent of the entire share market will be owned by Australian super funds over the next couple of decades.
“That’s a large jump,” he said. “So you are looking at talent which you wouldn’t previously have looked at, there’s a lot more confusion, there’s a lot more risk, there’s a lot more uncertainty in the investment side of the super funds.”
He describes the market for CIOs as “extremely tough”, with Covid creating a “double speed situation”. Normally you’d see retention and attraction to be slightly different from a strategy point of view, Mazumdar said, and often organisations would have a strong handle on either attracting or retaining key executives.
“But now both retention and attraction have become extremely difficult and most of the asset managers, the UBSs, the Goldman Sachs, the Macquarie Banks of the world, let alone the super funds, are holding on really tight to their heads of investments.”
Short-term versus long-term incentives
APRA’s performance test for super funds, which admittedly was introduced after the period covered by this survey but was being spoken about for some time before, may have had some influence on the breakdown of how super industry executives were remunerated.
According to Mazumdar, funds have become “more thoughtful and strategic in their management of investments” because how else would they differentiate their performance from one another apart from their returns?
“Yes, there are ESG initiatives, yes there are social causes, but at the end of the day for the more financially astute people they are looking at the investments,” he said.
But, that didn’t mean that the apparent trend to reward super industry executives with short-term incentives rather than long term was absolutely based on getting across the line with a performance review. It’s more nuanced than that.
“Common sense suggests that if someone gets incentivised by short-term incentives and the quantum of incentives are comparable to fixed salaries, these executives are going to be taking decisions that are more focussed on the short-term outcomes,” Mazumdar said.
“That’s probably a simplistic view though. In reality, a series of short-term decisions would actually lead to a positive long-term outcome and a lot of these short-term incentives are actually paid on that, so it’s not like completely new targets and measures are set up every year, target setting still considers a longer-time horizon although there is an absence of more structured long-term incentives,” he continued.
But there were caveats: “what you don’t have necessarily in this construct is what happens to people who leave in between or who come and go”.
“The reason why super funds traditionally don’t have a longer-term incentive plan is because they have largely evolved from a government-owned environment where in the government sectors you tend to see a fixed salary that depends on the complexity of the department, experience and skills required and very little, almost negligible short-term incentive and definitely no long-term incentive, even though the government needs to prepare and deliver on longer-term plans,” he said.
“People are working toward the longer-term sustainability… whether it comes in gradually where you reduce the salary a little bit or it comes in the form of a combined incentive plan we’ll have to wait and see. It probably would have started making an impact had Covid not hit… but from what I hear, it’s coming back and it’s coming back hard.”
A question of scale
As we did last year, Investment Magazine’s salary survey has ranked CIO and CEO pay according to assets under management and number of members respectively. Analysing executive pay in this way provides an insight into how much funds are paying for their executives in light of their size.
We recognise this kind of analysis may not provide a perfect view and there are myriad factors at play but it may help indicate trends.
With that in mind we looked at the top 20 super funds by assets under management and based the following analysis only on executives who had been continuously employed in the position throughout the survey period.
From that group, on a pay-per-member basis, Chris Davies, CEO of Telstra Super at $8.67 was the highest paid followed by CEO of Commonwealth Bank Group Super Scott Durbin at $8.48 per member, and then Kate Farrar from LGIA at $7.40.
At the other end of the scale, Vicki Doyle from REST was the lowest paid of continuously employed CEOs for the period along with Ian Silk from Australian Super at $0.44 and $0.45 respectively per member.
It’s worth noting that the larger funds by AUM such as AustralianSuper, Cbus, Hostplus and Sunsuper generally had lower costs based on this metric.
In terms of CIOs, on a pay-per AUM basis, Alison Tarditi from Commonwealth Superannuation Corporation came in lowest at $4.54 remuneration for each $1 million AUM followed by QSuper’s Charles Woodhouse at $6.88 and then AustralianSuper’s Mark Delaney with $7.08.
A similar pattern emerged here with the larger funds mostly having lower costs by this metric.[vc_tta_tabs spacing=”” active_section=”1″ el_class=”smsfaLayoutTabs paysurveyLayoutTabs blueTabs”][vc_tta_section title=”CEO PAY BY MEMBER” tab_id=”1647585340975-c5943ba2-cf5e”][vc_custom_heading text=””]


Leave a Comment
You must be logged in to post a comment.