

A decade of low interest rates made equity active management challenging. The 12 months to March 2022 were especially tough for this investment style.
‘Extreme’ events such as the pandemic stimulus and commodity-price shocks stemming from Russia’s invasion of Ukraine stirred inflation and triggered central-bank rate responses. Greater concentration of the largest stocks in popular benchmarks prompted global managers to be underweight in these big stocks. Investment biases meant many managers had shunned the energy stocks that surged on higher oil and gas prices. These factors merged into what Mercer declared was “a perfect storm” buffeting equity active investing over 2021-22.
This gale has calmed it seems. Mercer’s latest report on investment performance shows active equity management is generating decent returns above benchmark again. Even more encouraging for active managers is that Mercer expects future conditions to favour this style of investing.
“With the benefit of hindsight, March 2022 appears to mark the trough of equity active management performance,” say report authors Gareth Anderson and Kevin Murphy, senior equity research specialists at Mercer. “The performance of the median manager in Mercer’s global equity universe bounced back significantly in the 12-month period to March 2023.”
The improvement was consistent across most of the 21 categories Mercer tracks within equities. The median manager in 13 categories delivered ‘alpha’ to clients and all results were at least 100 basis points over benchmark. By contrast, in the ‘perfect storm’ 12 months to March 2022, the median manager only outperformed in nine categories and only delivered excess returns above 100 basis points in just four categories.
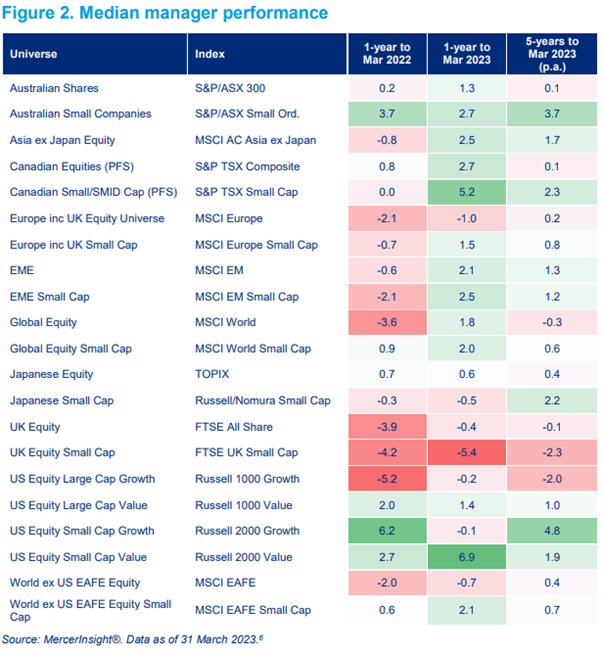
The report titled After the perfect storm – active management recovers looked at Australian, Asia-ex Japan, Canadian, European including-UK, emerging, global, Japanese, UK, US and World ex-US portfolios across growth and value styles and large and small caps.
Over the 12 months to March 2023, the best-performing category was US Equity Small Cap Value on +6.9 percentage points against benchmark, while Canadian Small/SMID Cap was second with +5.2 ppts. The worst category for the 12 months was UK Equity Small Cap with -5.4 ppts against index.
The report said that a meaningful underweight to the US and an overweight position across pan Europe helped equity active managers deliver into 2023. “The largely cautious stance taken by active global equity managers in the real-estate sector provided a further boost, as did their overweight in industrials.
“The index-like performance delivered by the IT sector in the 12 months ending March 2023 provided some relief from the multi-year headwinds that active global equity managers have faced as a result of the sector’s ongoing strength.”
Of note for asset allocators is that the authors predict the stock-picking environment should stay favourable for active managers.
The pair blame the struggles of active investing on distortions in stock valuations caused by low interest rates. These distortions led to the outperformance of speculative companies, stretched valuations on high-quality companies and cushioned highly indebted companies.
“Levering-up balance sheets to pay dividends and repurchase company shares also fuelled some of the appreciation and concentration in stock markets especially in US large caps, which created further challenges for active management,” they say.
The return of higher interest rates has reduced these imbalances. “If the distortions incentivising the ‘borrow to buy-back’ and ‘growth at any price’ regimes have run their course, the market concentration seen in the latter half of the previous cycle is unlikely to repeat in the coming years.
“This should lead to increased dispersion in stock returns – thereby likely creating a supportive environment for active management,” according to the Mercer report.
Over five years to March 2023, the median manager in 15 categories delivered excess returns on a per annum basis. The best performer was US Equity Small Cap Growth on +4.8 ppts p.a. followed by Australian Small Companies on +3.7 ppts p.a. The duds were UK Equity Small Cap on -2.3 ppts p.a. and US Equity Large Cap Growth on -2.0 ppts p.a.


Leave a Comment
You must be logged in to post a comment.